Technical analysis
Trendlines 101: How to navigate the market
Want to understand where the market’s heading? Trendlines, support and resistance have you covered!
These show the market direction and help identify levels where prices might change. Let’s dive into using them to your advantage!
Technical analysis
What is a trendline?
A trendline is a simple line you draw directly on the chart to see if the price is going up, going down or moving sideways.
🖊️ To draw one, press
 on the chart, then
  and choose Trend Line.
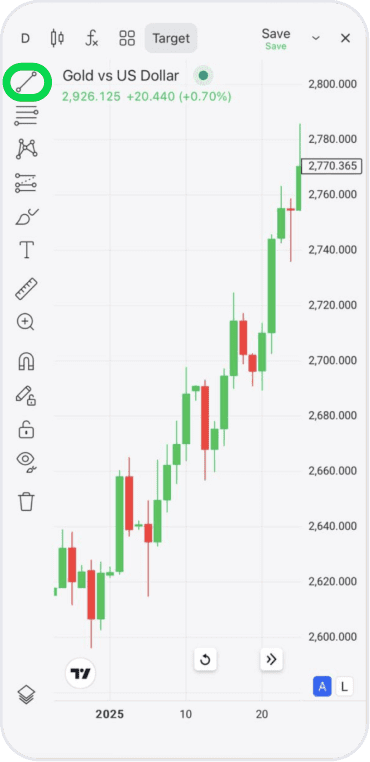
Technical analysis
Uptrend: Prices going up
⬆️ An uptrend happens when prices are rising, and each new high and low is higher than the last.
How to draw an uptrend line:
- Find the lowest points where the price dipped before rising again
- Connect those points with a line below the candles
- Extend the line to the right to see where the price might go next
💡 A quick tip: Traders often buy when the price touches the uptrend line and bounces back up. Ride the wave!

Technical analysis
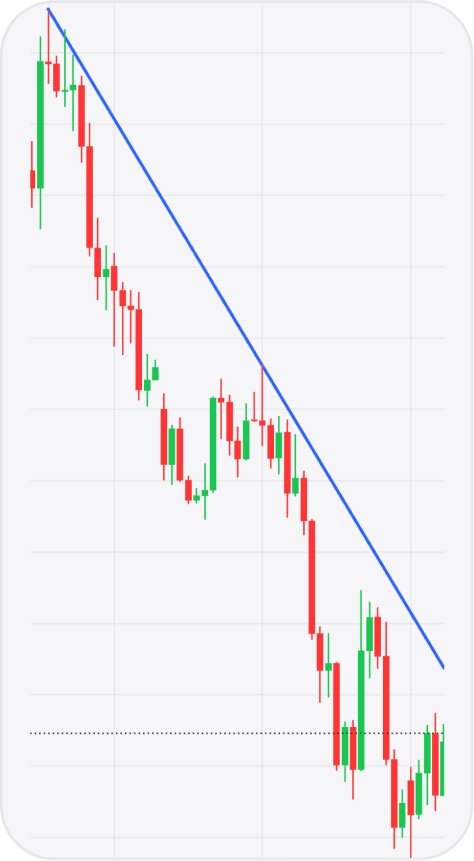
Downtrend: Prices going down
⬇️ A downtrend is when prices are falling, and each new high and low is lower than the previous one.
How to draw a downtrend line:
- Find the highest points where the price peaked before dropping again
- Connect those points with a line above the candles
- Extend the line to the right to see where the price might go next
💡 A quick tip: Traders often sell when the price touches the downtrend line and moves downward. Go with the flow!
Technical analysis
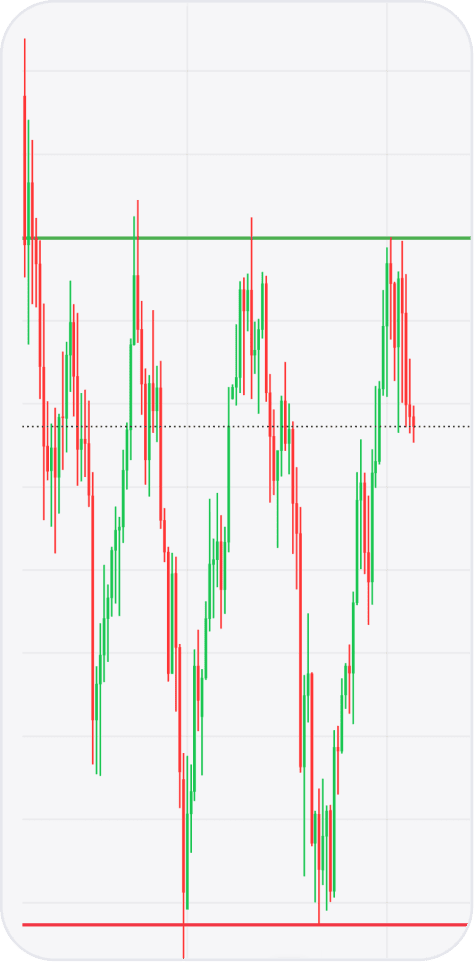
Sideways trend: No clear direction
↔️ When not much is going on, the market can move sideways. That’s when prices go back and forth without a clear trend.
How to draw a sideways trendline:
- Find the highs and connect them with a line
- Find the lows and connect them with a line
- Extend both lines to the right to see where the price might go next
💡 A quick tip: Traders often wait for a breakout before taking action. Patience pays off!
Technical analysis
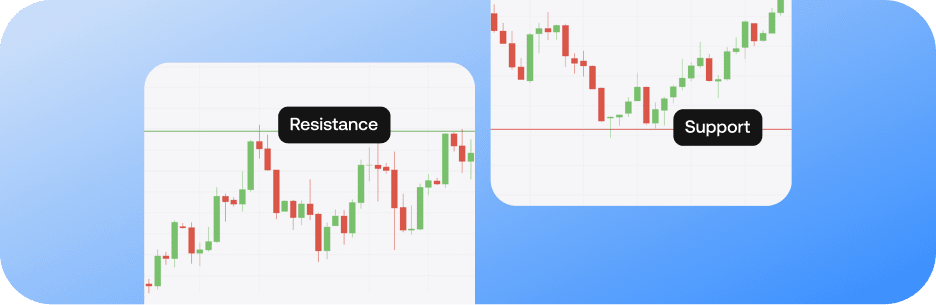
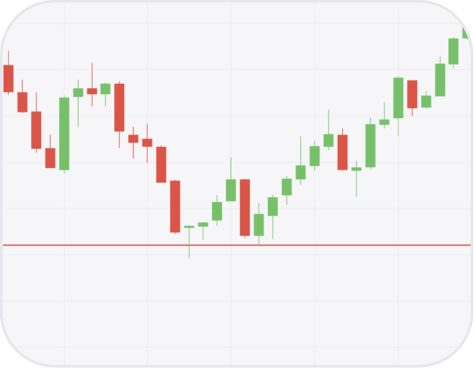
Support line: The market’s floor
🏠 The support is where the price tends to stop falling and bounce back up.
How to draw a support line:
- Find points where the price dropped but then bounced back up
- Connect the points with a horizontal line and extend it to the right
- Consider buying when the price approaches the support line and starts climbing
Technical analysis
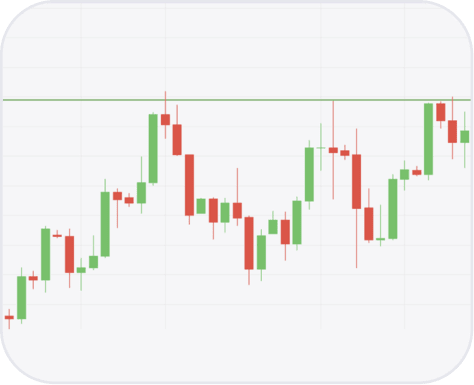
Resistance line: The market’s ceiling
⛅ The resistance is where the price tends to stop rising and fall back down.
How to draw a resistance line:
- Find points where the price rose but then fell back down
- Connect the points with a horizontal line and extend it to the right
- Consider selling when the price approaches and bounces off the resistance line
Technical analysis
Automatic support and resistance with pivot points
Don’t want to draw the lines manually? Let pivot points do the work for you! Pivot points automatically mark support and resistance levels.
To add them, press
on the chart, then  Indicators and choose Pivot Points Standard. That’s it! The lines will appear on your chart.
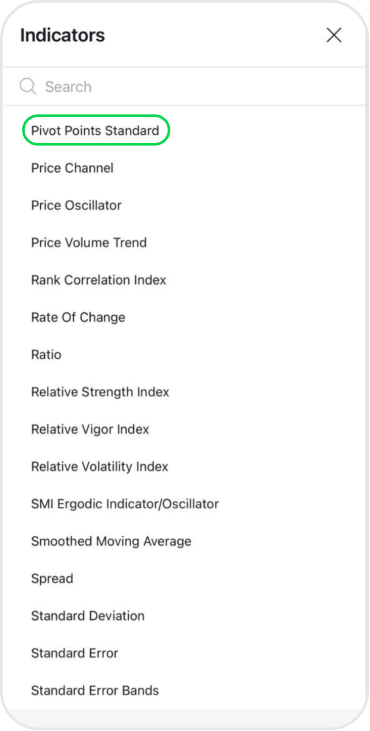
Technical analysis
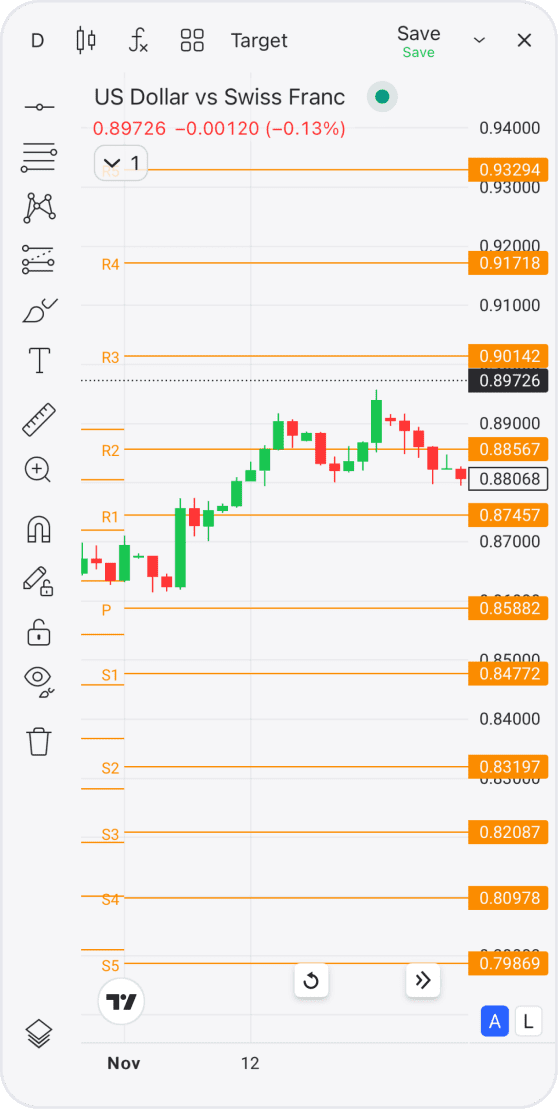
How to read pivot points
Pivot points automatically mark levels to track:
- Central pivot (P). The middle line. When the price is above it, that suggests a bullish trend, while the price being below suggests a bearish trend
- Support (S1–S5). Lines below the current price indicate where the price might stop falling and start rising again
- Resistance (R1–R5). Lines above the current price indicate where the price might stop rising and start falling again
Technical analysis
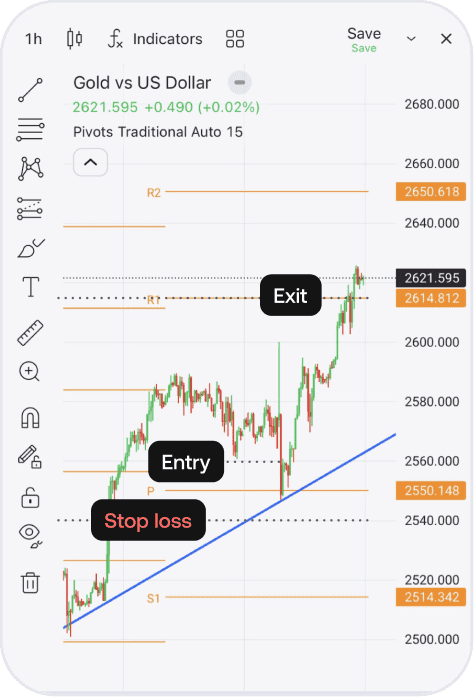
An example trade with support and resistance
Let’s say you spot an uptrend and draw a trendline.
- You mark support and resistance with pivot points
- After a pullback (when the price drops), you enter a buy trade when the price bounces back up from support
- Set the stop loss below support and take profit at the next resistance
Technical analysis
Quick quiz: Test your knowledge
Why do traders use support and resistance lines?
Technical analysis
Summing up
You did great! Here’s what you’ve learned:
- How to draw trendlines and identify key levels
- What support and resistance are
- How pivot points automatically mark support and resistance
- How to use these tools to plan smarter trades
Next up, we’ll explore trading indicators and how to use them effectively. Keep going — you’re doing amazing!