-
Trading indicators
Meet trading indicators: Your market sidekicks
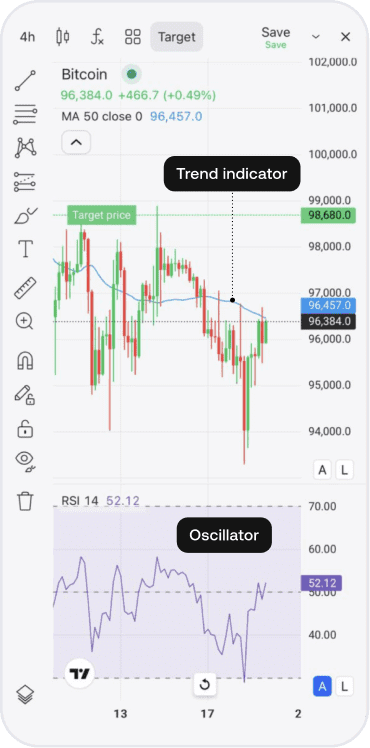
🦸♂️🦸♀️ Want to know if a trend is strong or if a reversal is coming? Trading indicators have got your back! They help you read the charts and spot trends. There are two main types of indicators:
- Trend indicators
- Oscillators
Let’s break them down!
-
Trading indicators
Trend indicators: Detecting market direction
Trend indicators are your GPS for the market. They smooth out the chaos and help you follow the big moves — whether the market’s going up, down or just chilling sideways.
To add indicators to your chart, press
 then
then  and choose the one you want. It will appear either on your chart or below it, depending on which one you picked.
Let’s take a closer look at moving averages!
-
Trading indicators
Moving averages: The market’s bread and butter
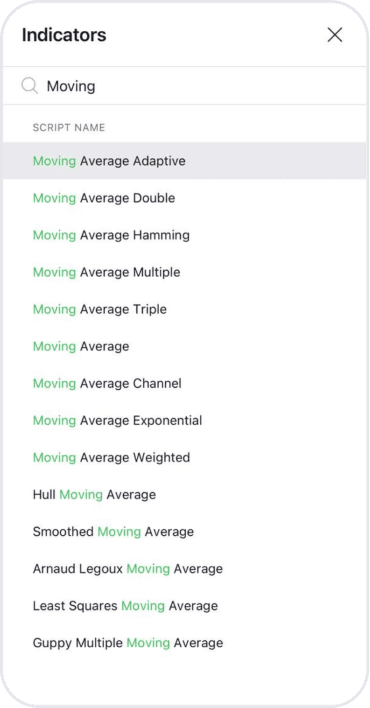
Moving Averages (MAs) are the rockstars of trend indicators. They calculate the average price over a specific period of time, making it easier to spot trends. Find MAs by typing “Moving Average” in the indicators list.
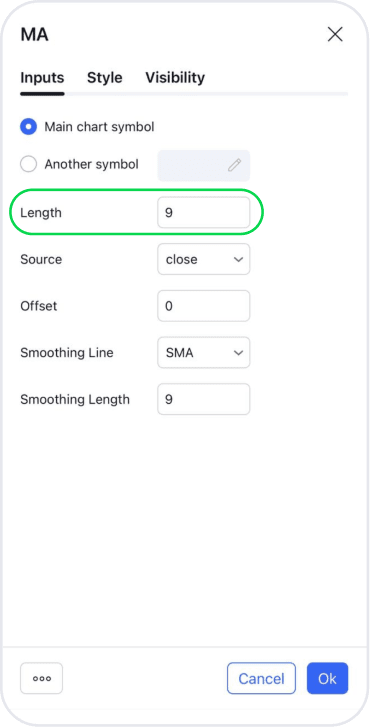
💡 A quick tip: Adjust the MA’s timeframe to make it smoother (longer) or more responsive (shorter).
-
Trading indicators
How to work with moving averages
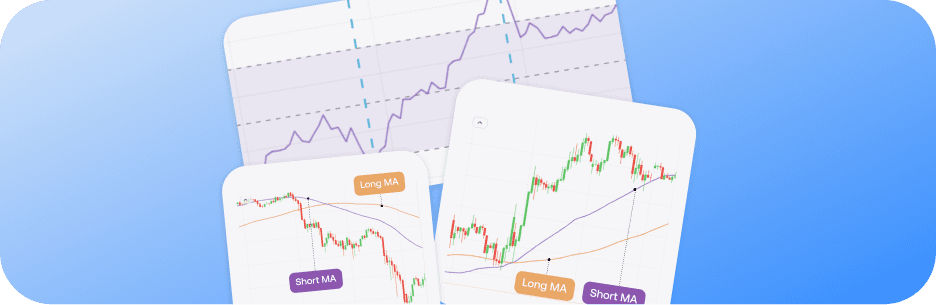
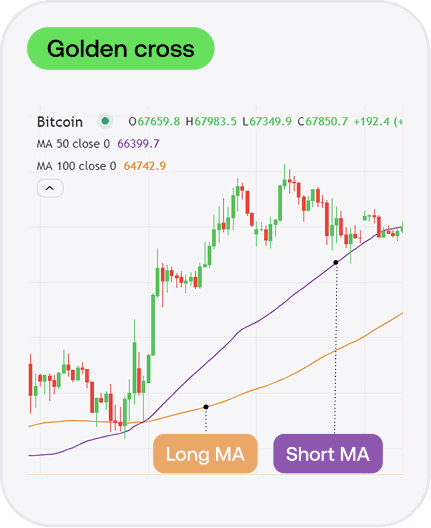
Here’s the deal: When the price is above the MA, it’s usually an uptrend. Below? You’re looking at a downtrend. But the real magic happens when two MAs cross each other.
📈 A golden cross (the short MA crosses above the long MA) signals a potential uptrend.
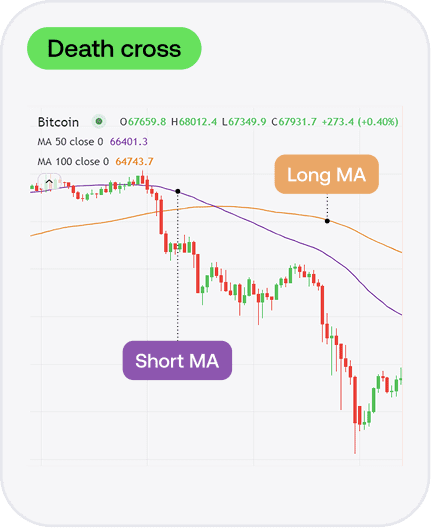
📉 A death cross (the short MA crosses below the long MA) hints at a potential downtrend.
Be careful: MAs can lag behind the market, so they sometimes signal trends after they’ve already started.
-
Trading indicators
MAs as dynamic support and resistance
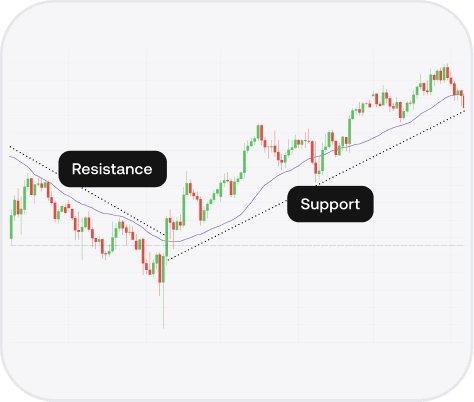
Here’s the MA’s best party trick: It can act as a moving support or resistance.
📈 In an uptrend: The price might bounce off the MA like it’s the support (the floor)
📉 In a downtrend: The MA can act like a ceiling, preventing the price from rising higher
-
Trading indicators
Oscillators: Detecting market pressure
Oscillators measure market strength and help you find good entry points. One of the most popular oscillators is the Relative Strength Index (RSI), which helps determine if the market is overbought or oversold.
To add it to your chart, press
then and choose RSI. -
Trading indicators
RSI: Your overbought and oversold radar
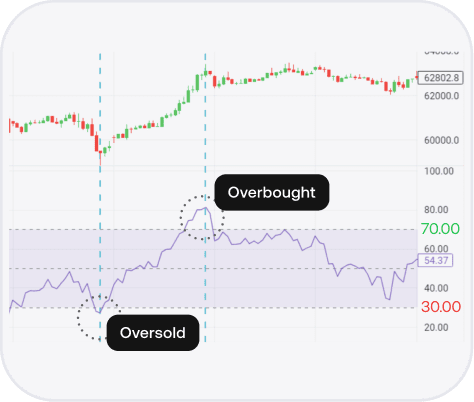
The RSI is like a market pressure gauge, with a line bouncing between key levels. The magic numbers? 70 and 30.
🔼 An RSI above 70 means the market is overbought (it might reverse)
🔽 An RSI below 30 means the market is oversold (it might bounce back)
RSI is great for spotting potential turning points!
-
Trading indicators
Example of trading with the RSI
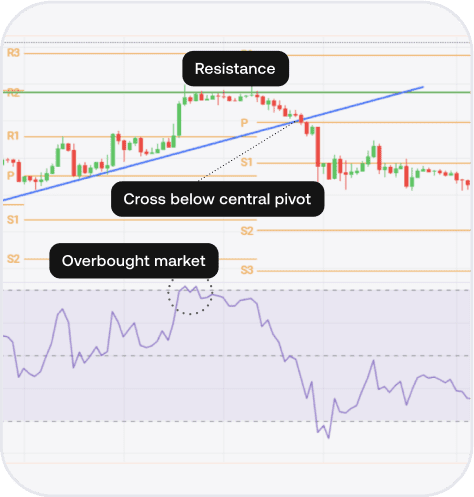
Let’s take a look at a real-world example.
- After hitting the R2 pivot resistance, the RSI entered the overbought zone, hinting at a potential reversal
- The price couldn’t break above R2, so traders waited for it to drop below the trendline
- Once the price crossed the central pivot, the downtrend was confirmed
-
Trading indicators
Pro tips for using indicators
- Combine indicators. Use trend indicators to identify market direction and oscillators for precise entries and exits
- Keep it simple. Don’t overcrowd your chart. Stick to two key indicators that work well together
- Test first. Always test your indicators using historical data before trading with real money
-
Trading indicators
Quick quiz: Test your knowledge
What do trading indicators help you do?
-
Trading indicators
Summing up
Great job! You’ve learned:
- What trend indicators and oscillators are
- How to use Moving Averages to spot trends
- How the RSI helps identify overbought and oversold markets
- How to combine indicators for better trades
Next up, we’ll dive into fundamental analysis. You’re doing great — keep going!